- Гідрологія і Гідрометрія
- Господарське право
- Економіка будівництва
- Економіка природокористування
- Економічна теорія
- Земельне право
- Історія України
- Кримінально виконавче право
- Медична радіологія
- Методи аналізу
- Міжнародне приватне право
- Міжнародний маркетинг
- Основи екології
- Предмет Політологія
- Соціальне страхування
- Технічні засоби організації дорожнього руху
- Товарознавство продовольчих товарів
Тлумачний словник
Авто
Автоматизація
Архітектура
Астрономія
Аудит
Біологія
Будівництво
Бухгалтерія
Винахідництво
Виробництво
Військова справа
Генетика
Географія
Геологія
Господарство
Держава
Дім
Екологія
Економетрика
Економіка
Електроніка
Журналістика та ЗМІ
Зв'язок
Іноземні мови
Інформатика
Історія
Комп'ютери
Креслення
Кулінарія
Культура
Лексикологія
Література
Логіка
Маркетинг
Математика
Машинобудування
Медицина
Менеджмент
Метали і Зварювання
Механіка
Мистецтво
Музика
Населення
Освіта
Охорона безпеки життя
Охорона Праці
Педагогіка
Політика
Право
Програмування
Промисловість
Психологія
Радіо
Регилия
Соціологія
Спорт
Стандартизація
Технології
Торгівля
Туризм
Фізика
Фізіологія
Філософія
Фінанси
Хімія
Юриспунденкция
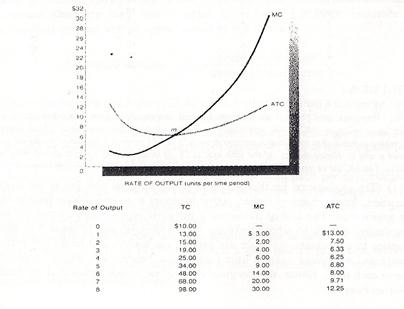
The relationship of marginal cost to average total cost
Figure 9 brings together the average and marginal cost curves. The centerpiece of Figure 9 is the U-shaped ATC curve. What is of special significance is its relationship to marginal costs. Notice that the MC curve intersects the ATC curve at its lowest point(point m). This will always be the case. So long as the marginal cost of producing one more unit is less than the previous average cost, average costs must fall. Thus average costs decline as long as the marginal cost curve lies below the average cost curve, as to the left of point m in Figure 9.
We have already observed, however, that marginal costs themselves tend to rise as output expands, largely because additional workers reduce the amount of land and capital available to each worker (in the short run, the size of plant and equipment is fixed). Consequently, at some point (m in Figure 9) marginal costs will rise to the level of average costs.
As marginal costs continue to rise beyond point m, they begin to pull average costs up, giving the average cost curve its U shape. Average costs increase whenever marginal costs exceed average costs. This is the case to the right of point m, since the marginal cost curve always lies above the average cost curve in that part of Figure 9.
| <== попередня сторінка | | | наступна сторінка ==> |
| | | Figure 9 |
|
Не знайшли потрібну інформацію? Скористайтесь пошуком google: |
© studopedia.com.ua При використанні або копіюванні матеріалів пряме посилання на сайт обов'язкове. |